Hyperspectral image analysis
Introduction to practical training with CoreSpecViewer
What is Hyperspectral Imaging?
Some definitions
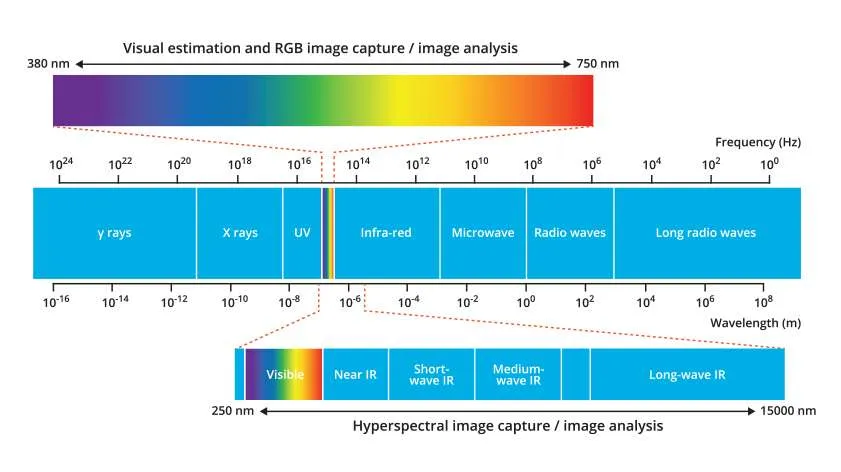
Figure taken from ruby-sapphire.com
Visible light imaging
These are the standard images we take on a phone or camera. The instrument samples three bands of the visible portion of the electromagnetic spectrum, red, green and blue.
Spectral Imaging
Spectral imaging samples the electromagnetic spectrum in multiple bands beyond the visible.
- Multispectral images capture 3–15 broad bands.
- Hyperspectral images capture hundreds of narrow contiguous bands across the electromagnetic spectrum.
What is Hyperspectral Imaging?
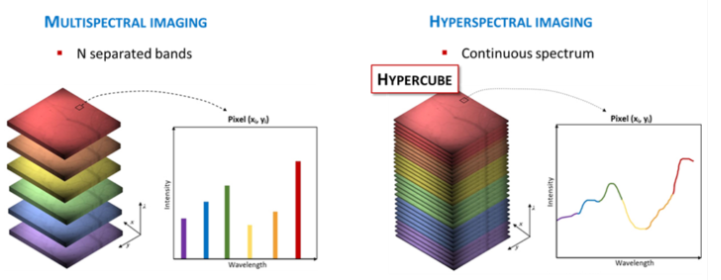
- A hyperspectral image is a 3-dimensional array where z is wavelength.
- Spectral resolution is determined by number of bands, bandwidth and range. More bands and narrower bandwidth give higher spectral resolution.
Image from: https://www.nireos.com/hyperspectral-imaging/
Where can we get hyperspectral images?
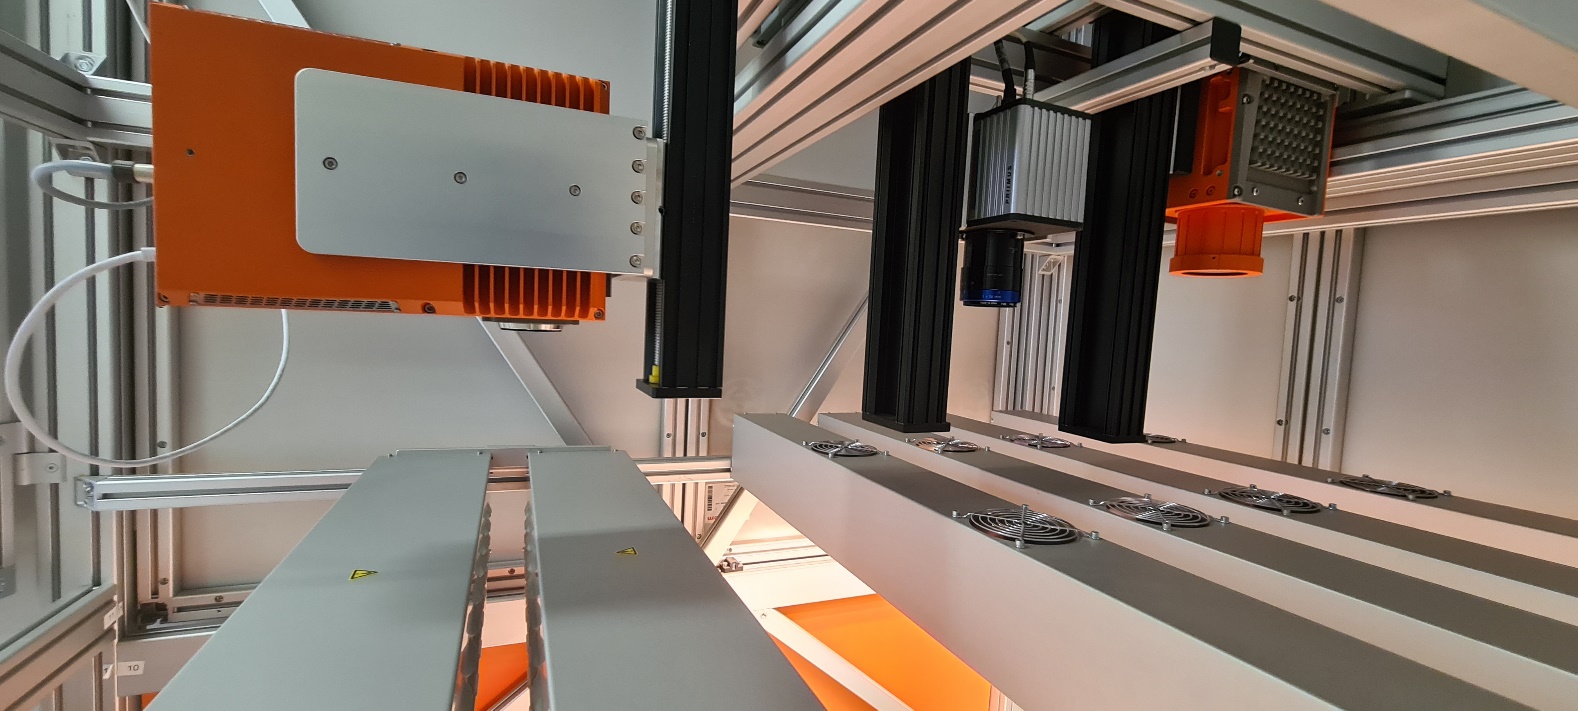
Geological Survey Ireland Core Scanning
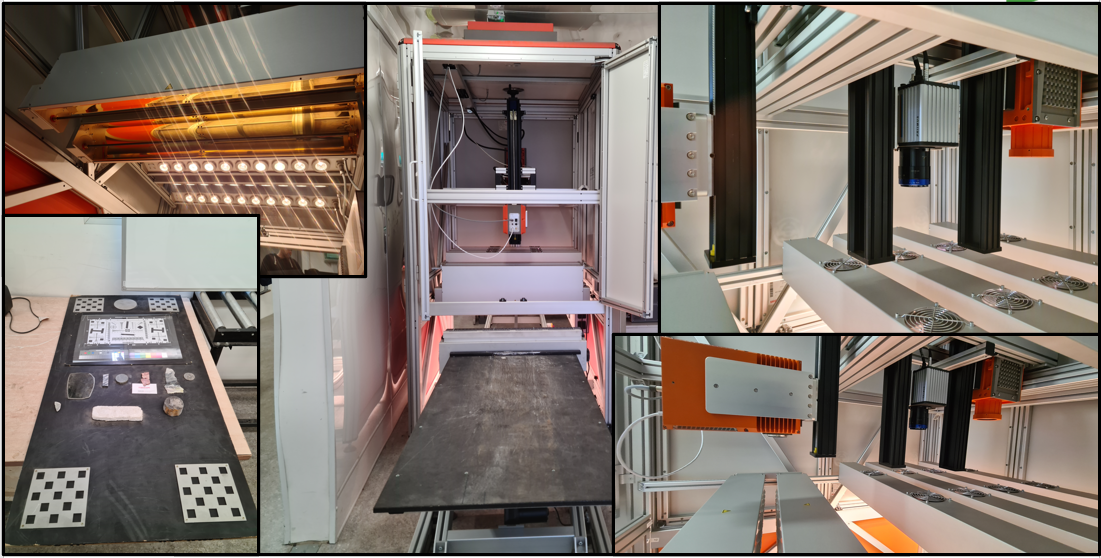
Over 1400 drillholes scanned, producing >80TB of data. Intention to scan entire collection ~500km of drill core.
Geological Survey Ireland Core Scanning
Spectrum figure taken from ruby-sapphire.com
Mid-Wave Infra-Red (MWIR) Camera
- Bands: 154
- Range: 2712nm – 5274nm
Short Wave Infra-Red (SWIR) Camera
- Bands: 288
- Range: 978nm – 2580nm
Visible light (RGB) Camera
- Bands: 3
- Range: 440nm, 550nm, 630nm (discrete bands)
Why do we care about hyperspectral images?
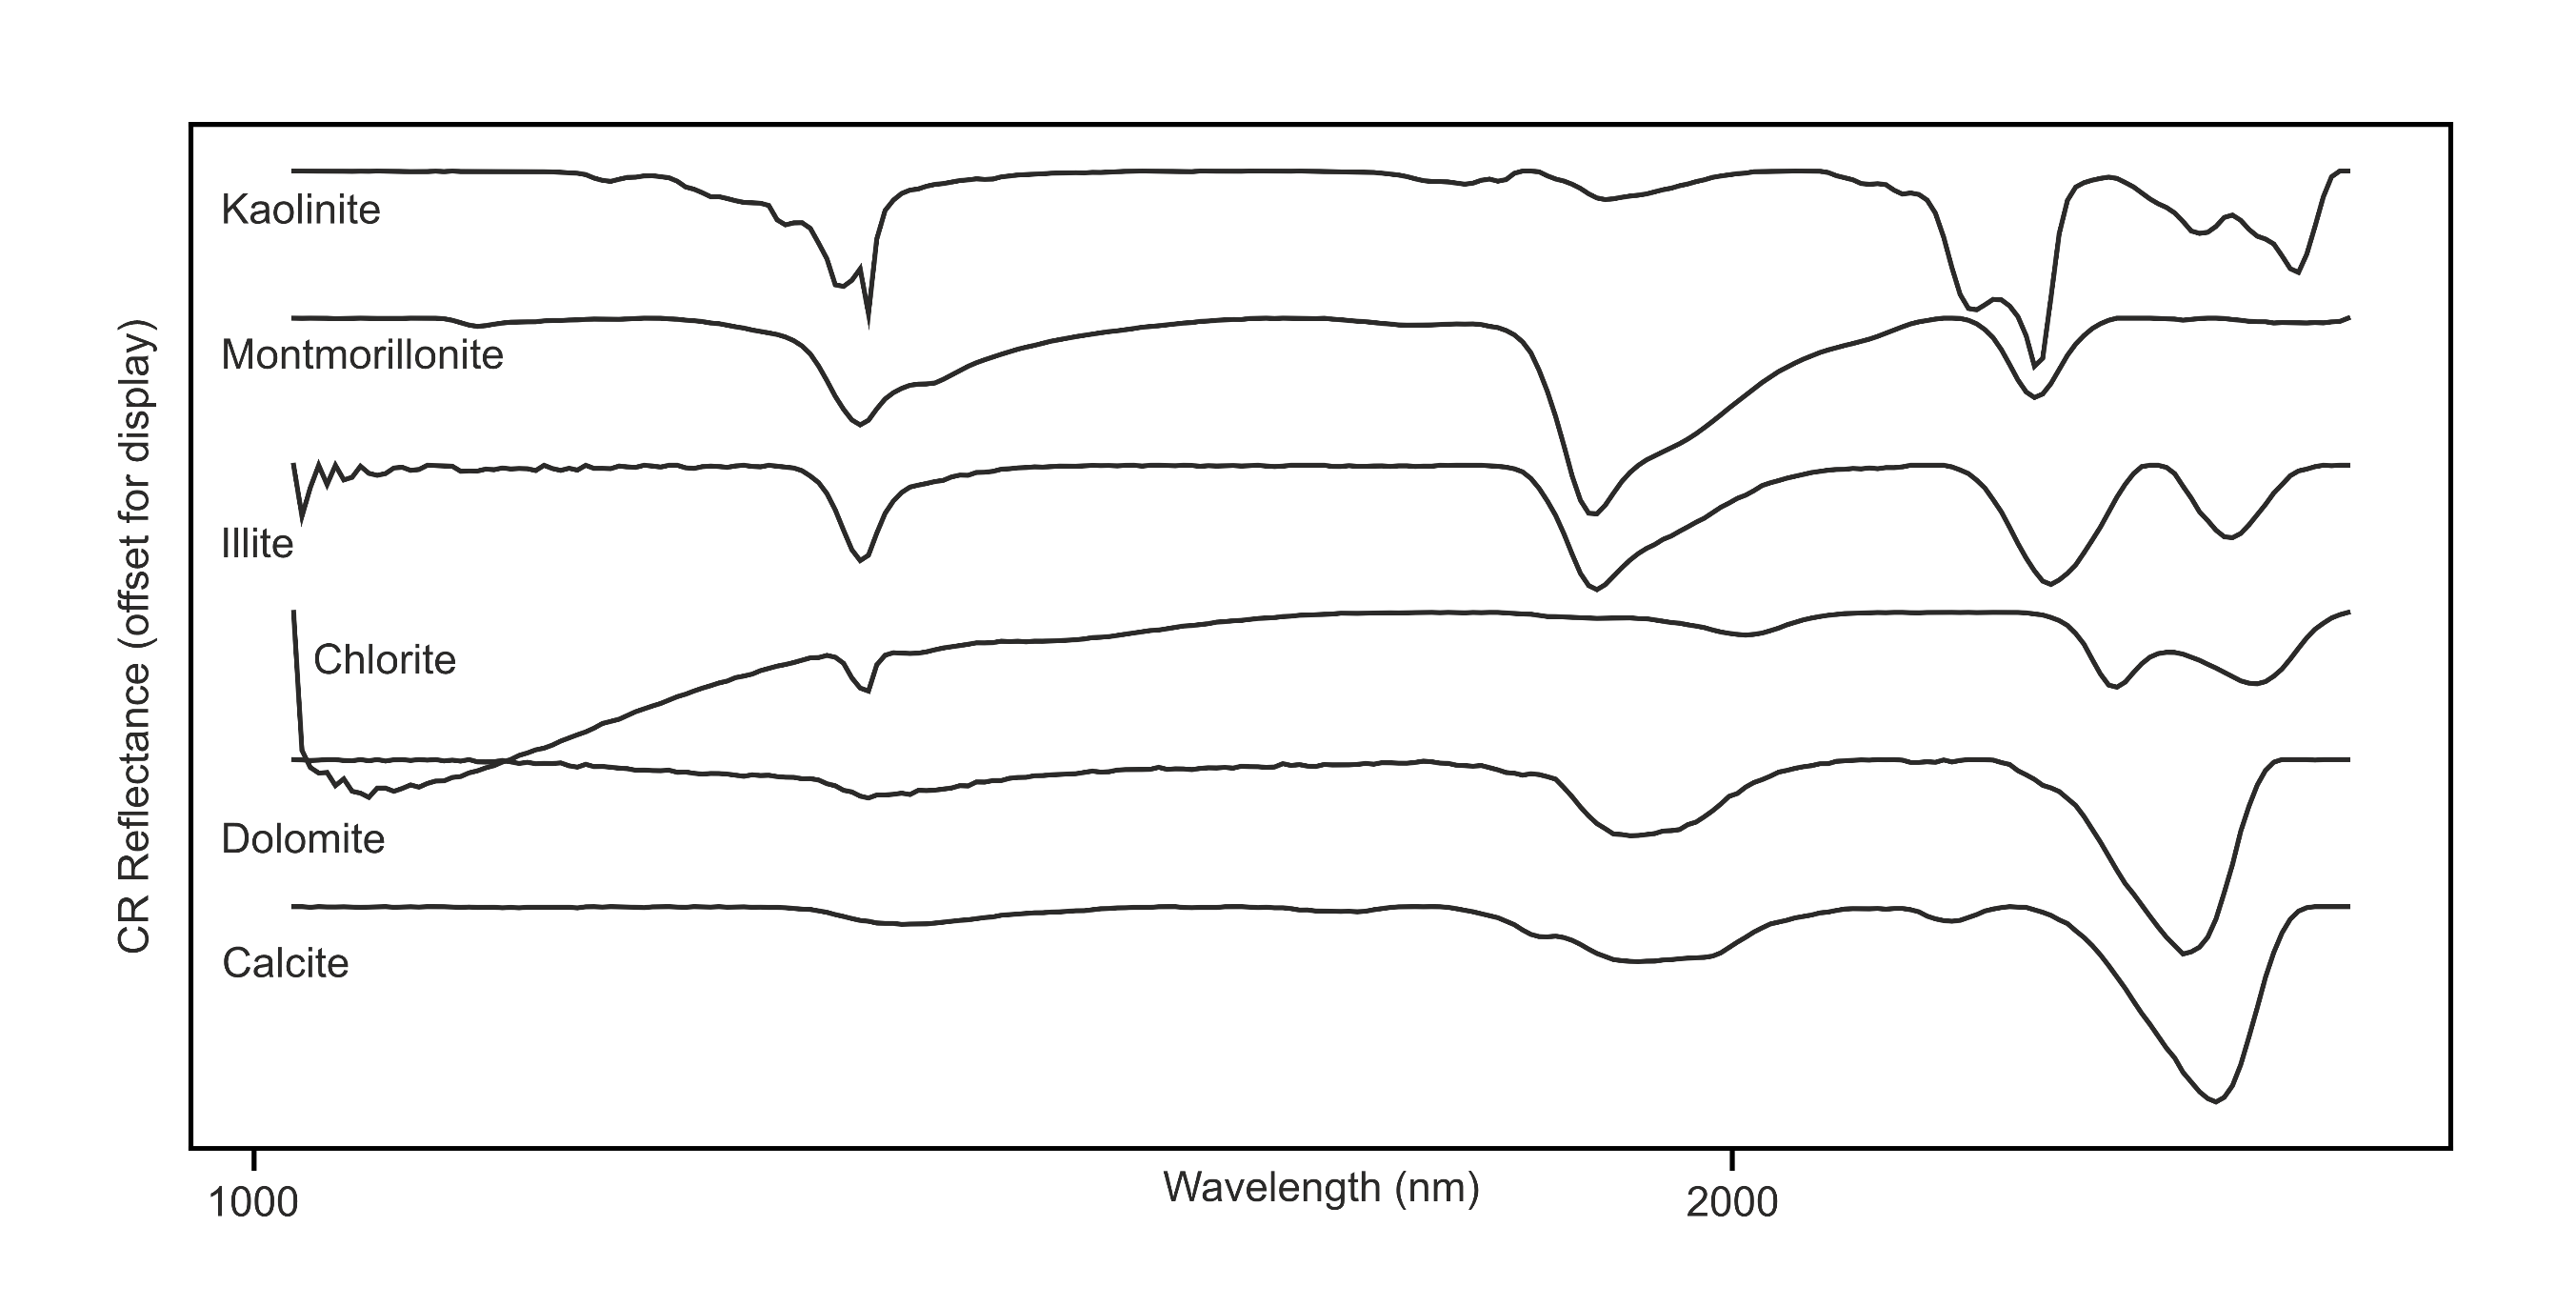
Diagnostic Mineral Absorption features
- Energy of different wavelengths is absorbed or reflected.
- Absorption or reflectance can vary with mineral chemistry.
- Features known to be diagnostic of certain minerals can be observed in the spectra.